eMission
Interactive Web Design and Development
eMission is my thesis project for my MFA program in Academy of Art University.
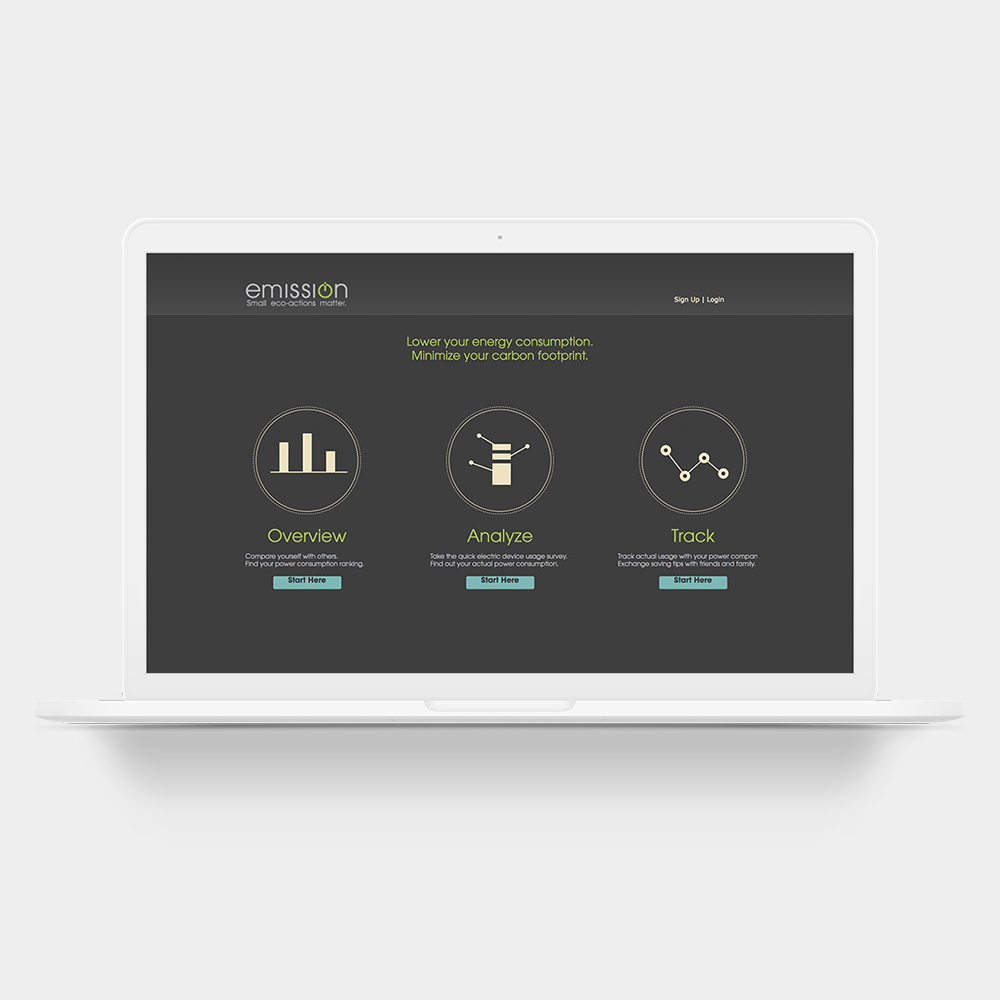
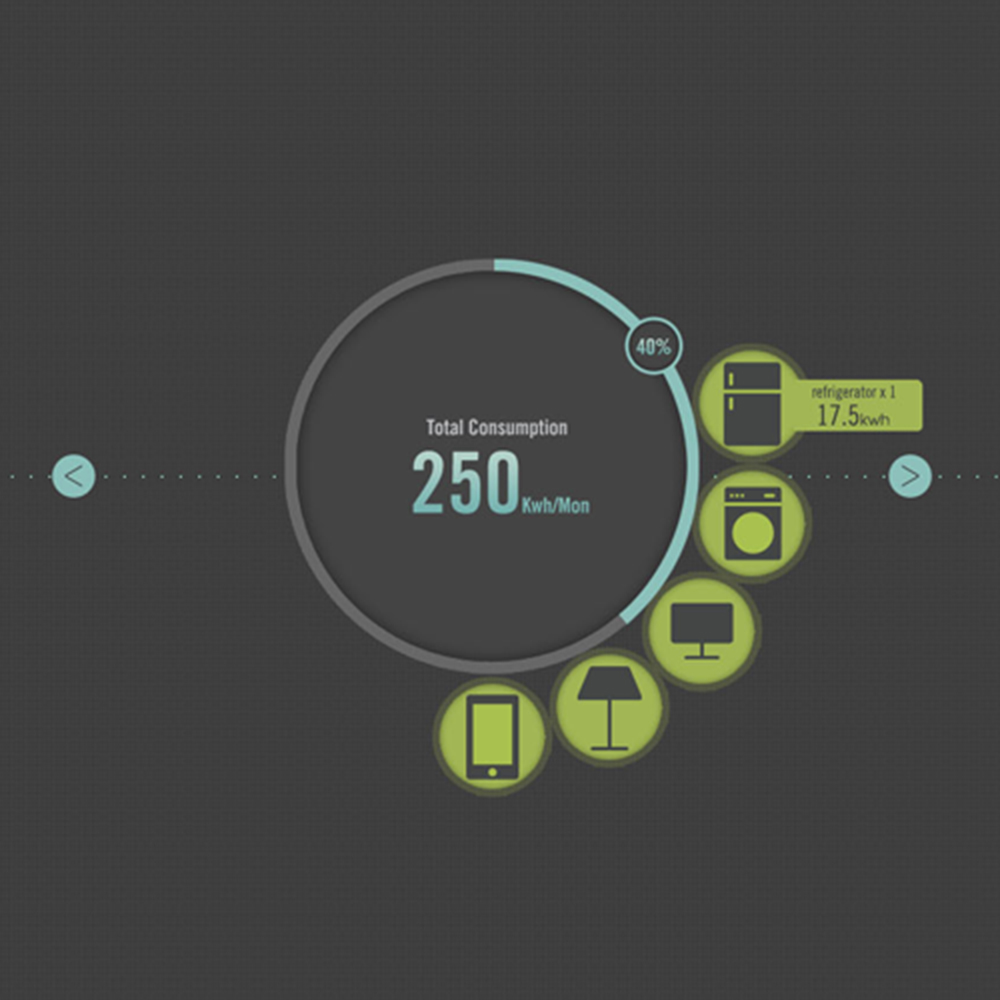
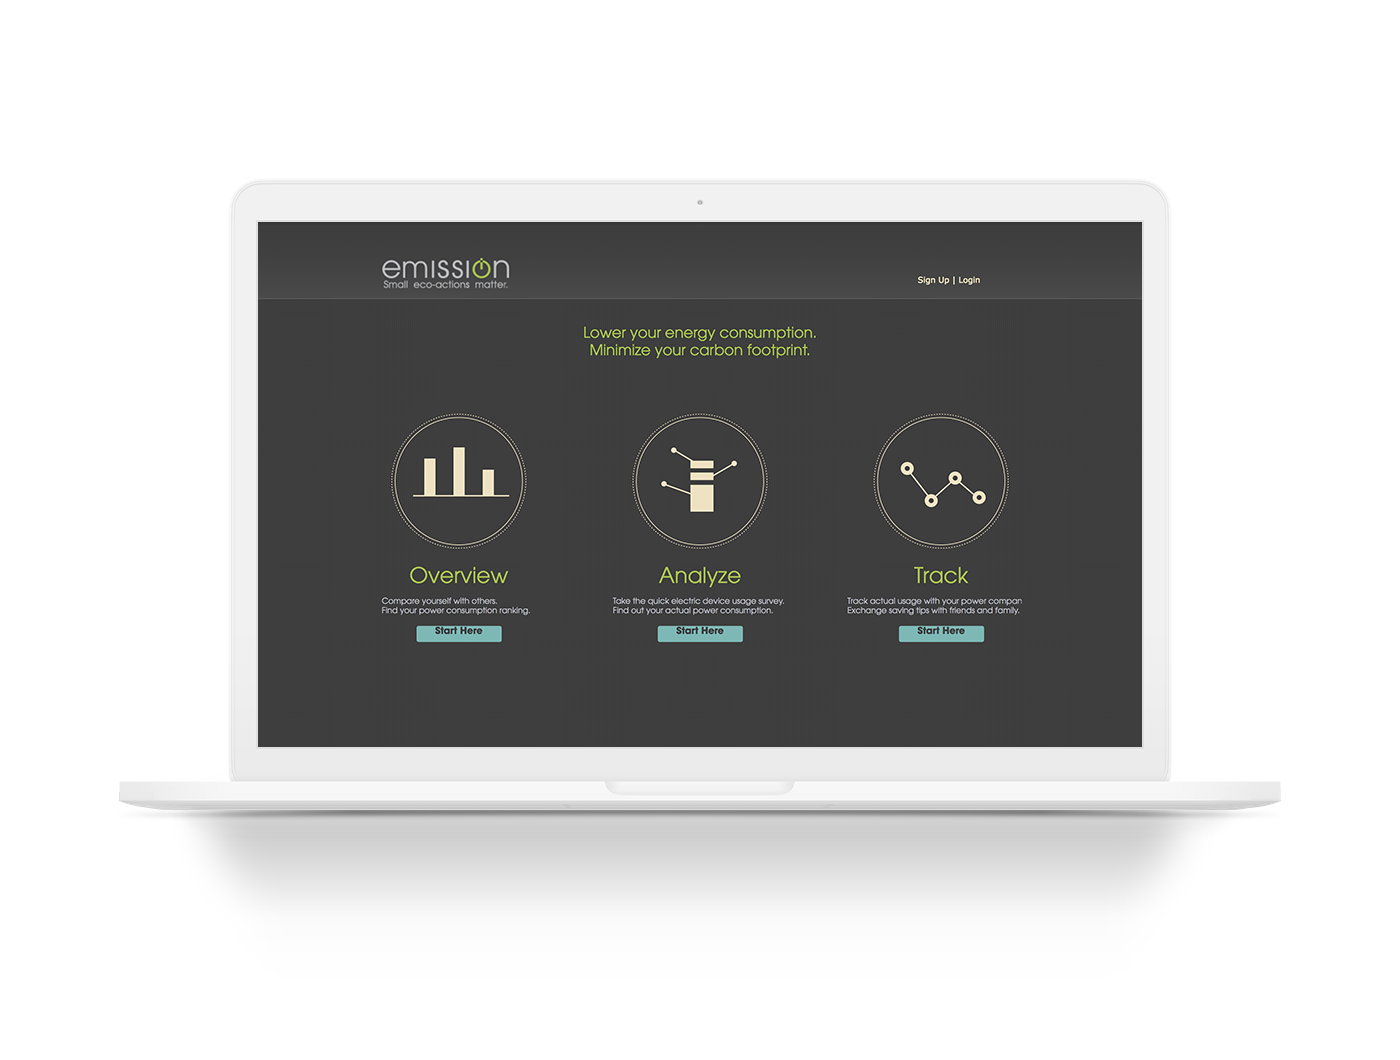
It is an interactive website that helps user analyze their power usage and provide them customized energy saving tips.
The goal of the website is to spread the awareness of energy saving and encourage user to save energy.
Skills: User Research, UI Design, HTML/CSS, Javascript(jQuery, SVG, D3.js)
Target Audience
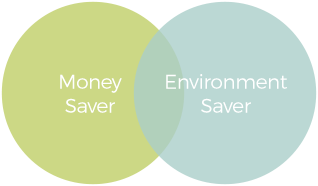
Primary Target Audience
People with tight buget
Young people who are struggling to settle down, mid- age people who have to support a big family.
Basically people who have a tight budget and are trying to figure out ways to save money and lower their energy bill.
Age: 25-50
Secondary Target Audience
People who want to protect environment
Young people who don’t have financial stress but would like to be green if they know how.
They are also getting used to social media and would like to share their green wishes with their friends.
Age: 20-30
Persona

Ann Chen
Stay At Home Mom
32, Married, 1 Kid
Philadelphia, PA
Psychographic Attributes:
Patient, Considerable
Purposes:
Find ways to lower down her utility bill.
Brand influence and exposure:
Amazon, Ebay, Microsoft
Technology:
Windows 7
Internet Explorer
1920x1080 monitor resolution
Broadband
Tasks and Scenarios:
The electricity bill for Ann´s family is always higher than $100. She wants to find out which devices are consuming the most power, and possible saving actions to take.
Interaction Mode
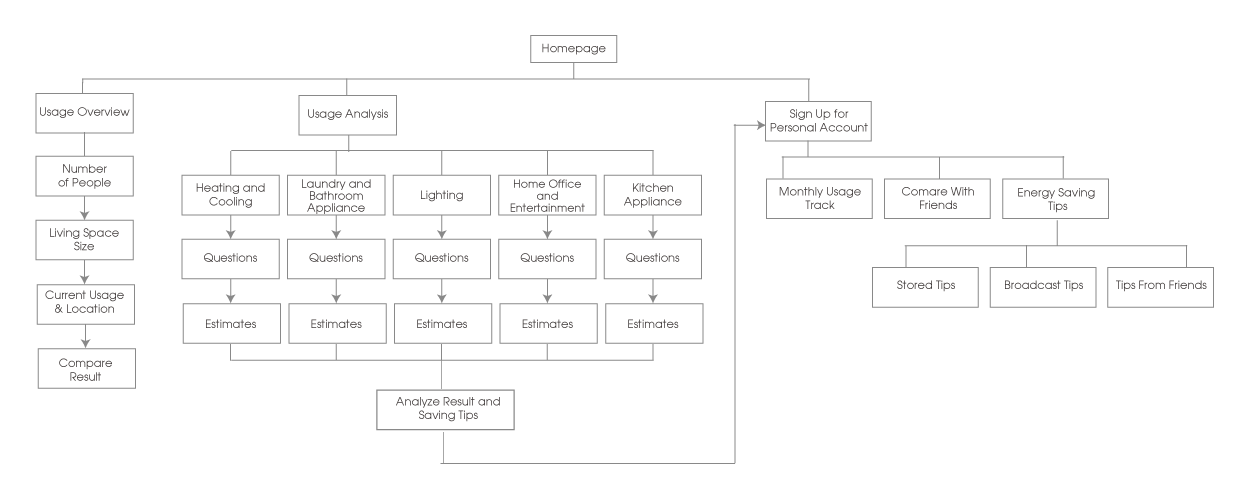
Information Architecture
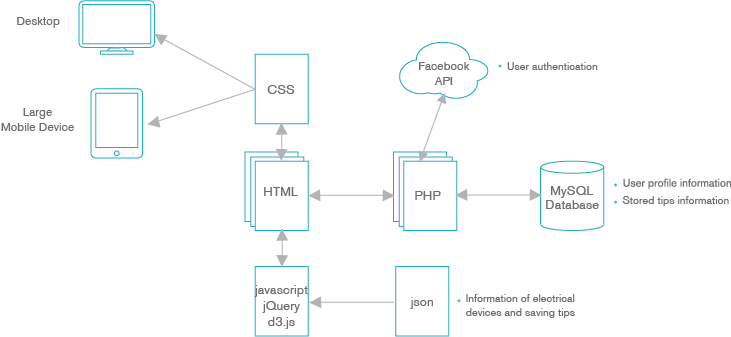
Technical Specification
Technical Experiments

Everyone knows that Flash is dying, and it´s quite possible that javascript is going to lead the role for developing interactive websites. So when I designed my site, I tried to put some interactive actions and transitions to it and would like to try to build the site according to my design.
I took this opportunity to get a deeper understanding of javascript. I used jQuery to create the interactive actions and transitions of the frontend of my project.
Also, combining SVG and d3.js enables me to visualize the big amount of data in my project, and make animation and transition of it.
Other than that, I used some of the new CSS3 properties to create some visual effects that were impossible for website before. Like embed my own font-face in my site to keep the typography consistent with my design, create pure CSS navigation, gradient background, and shadow.
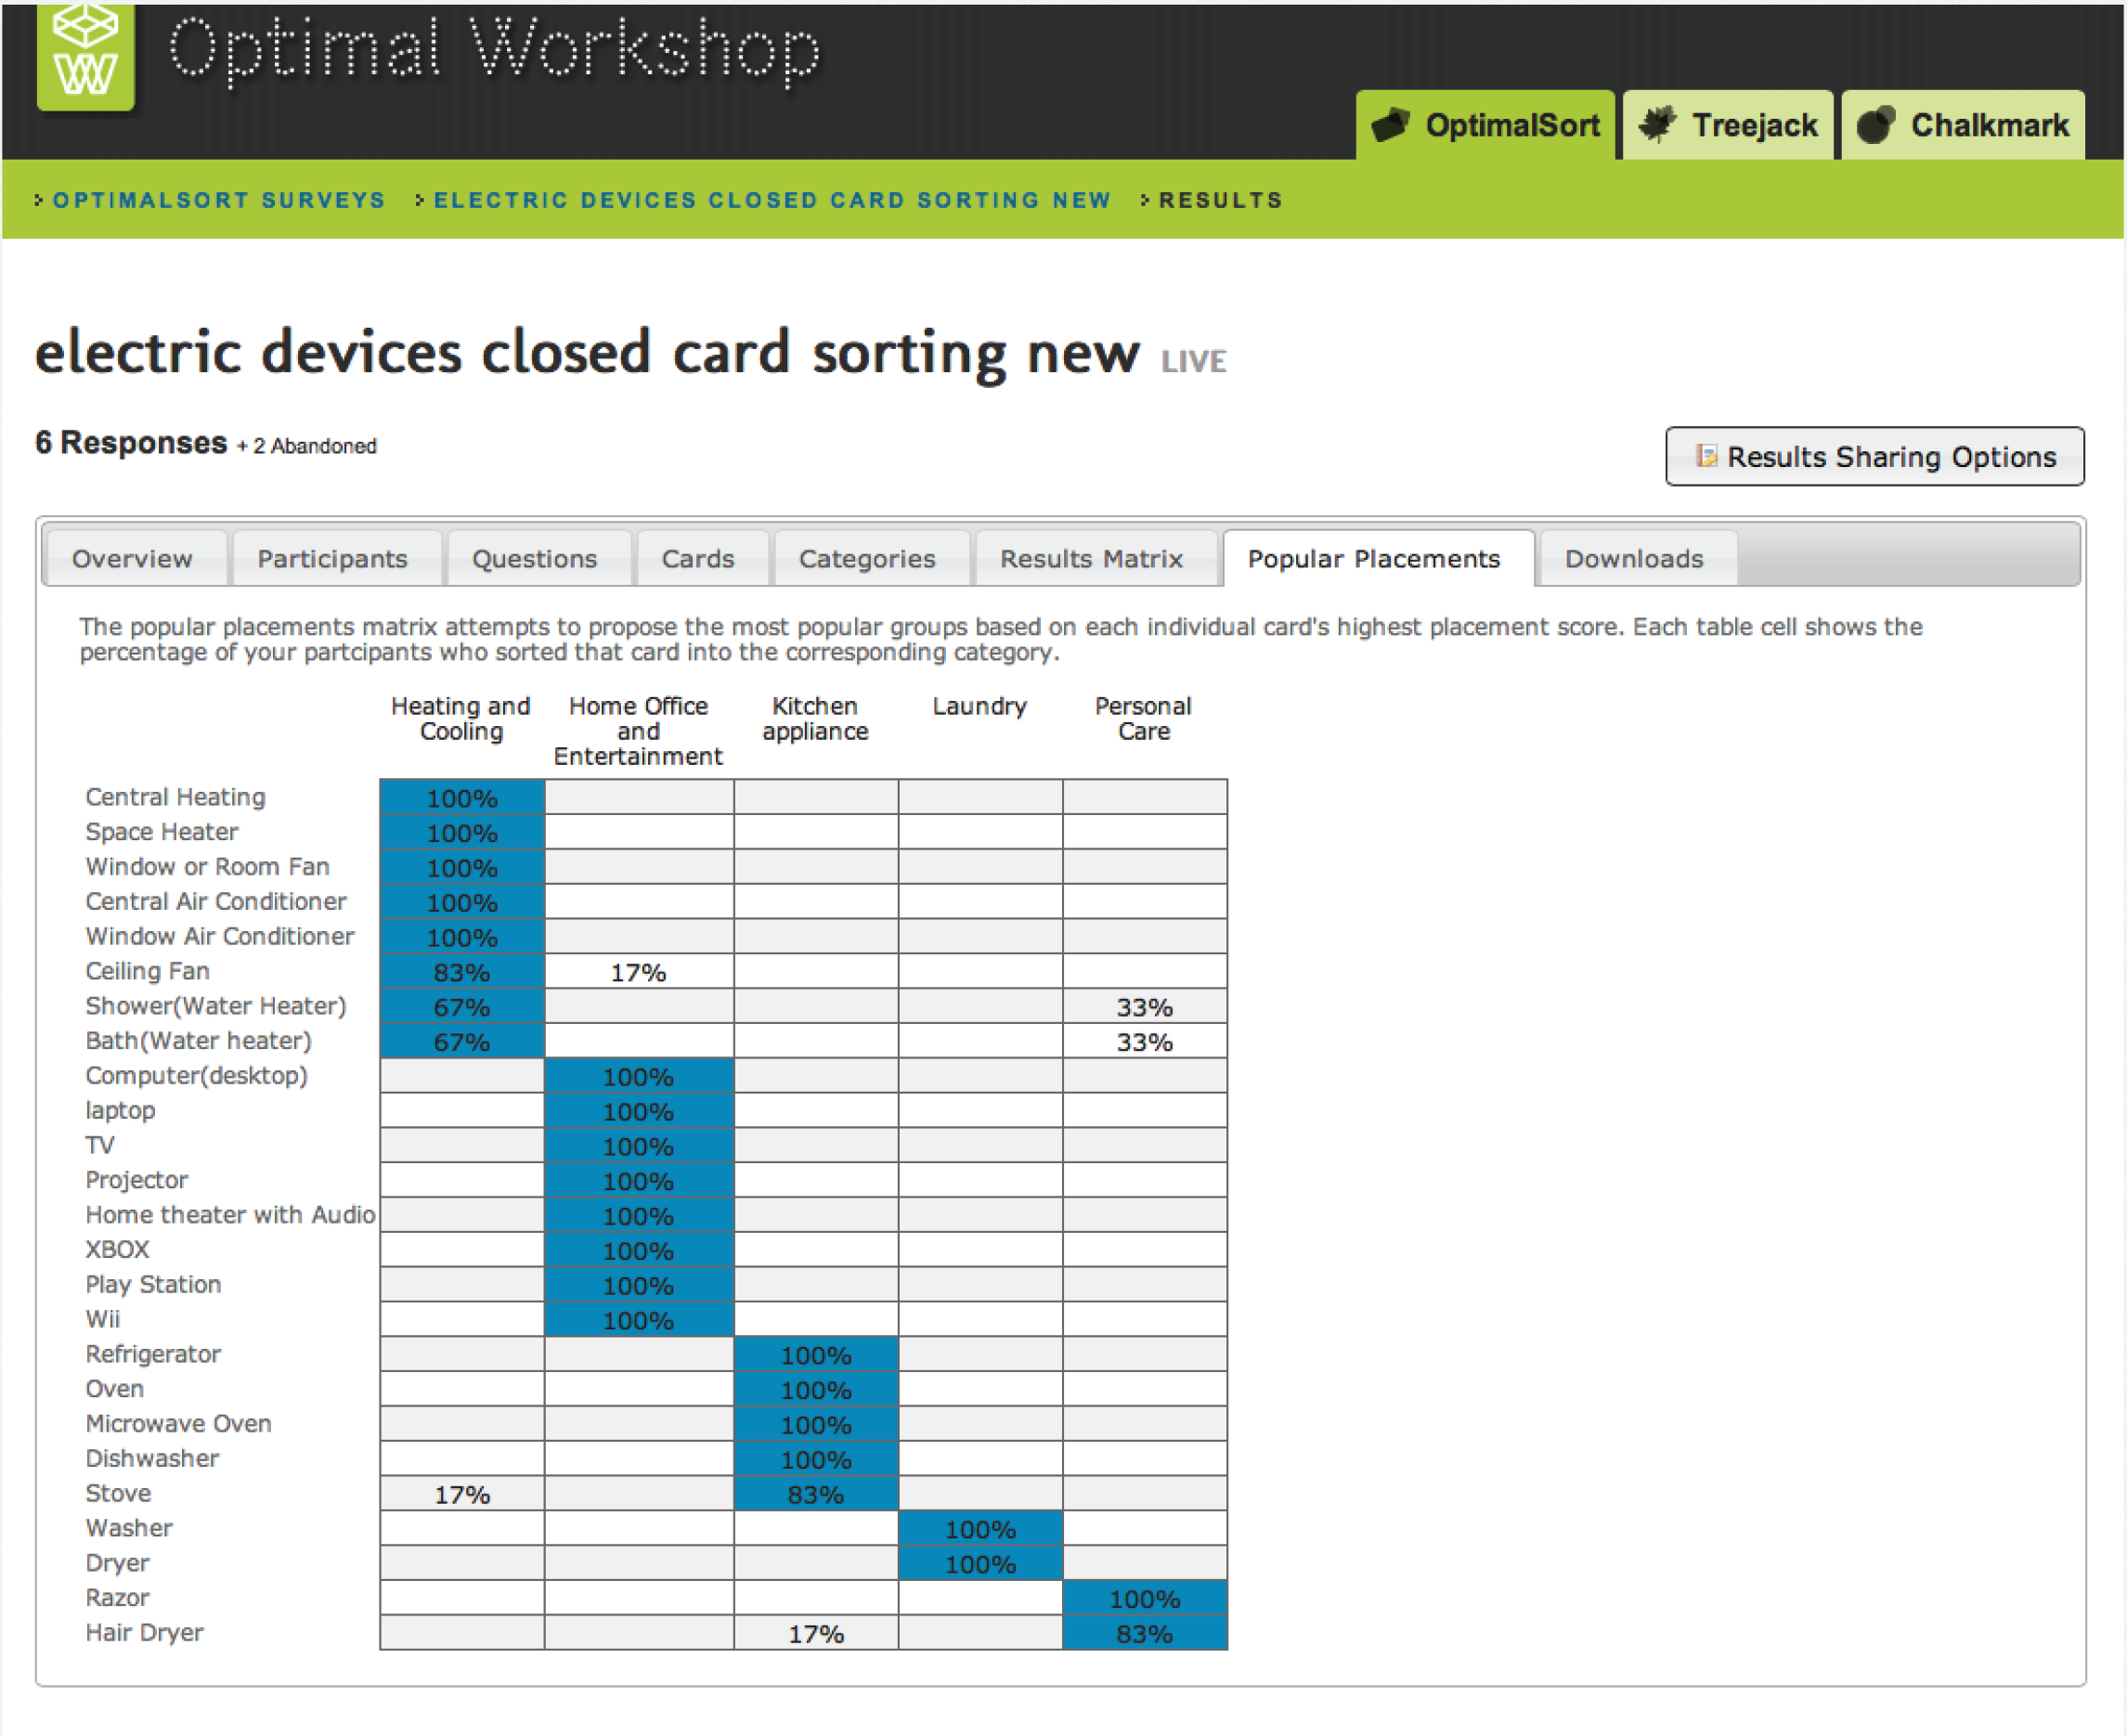
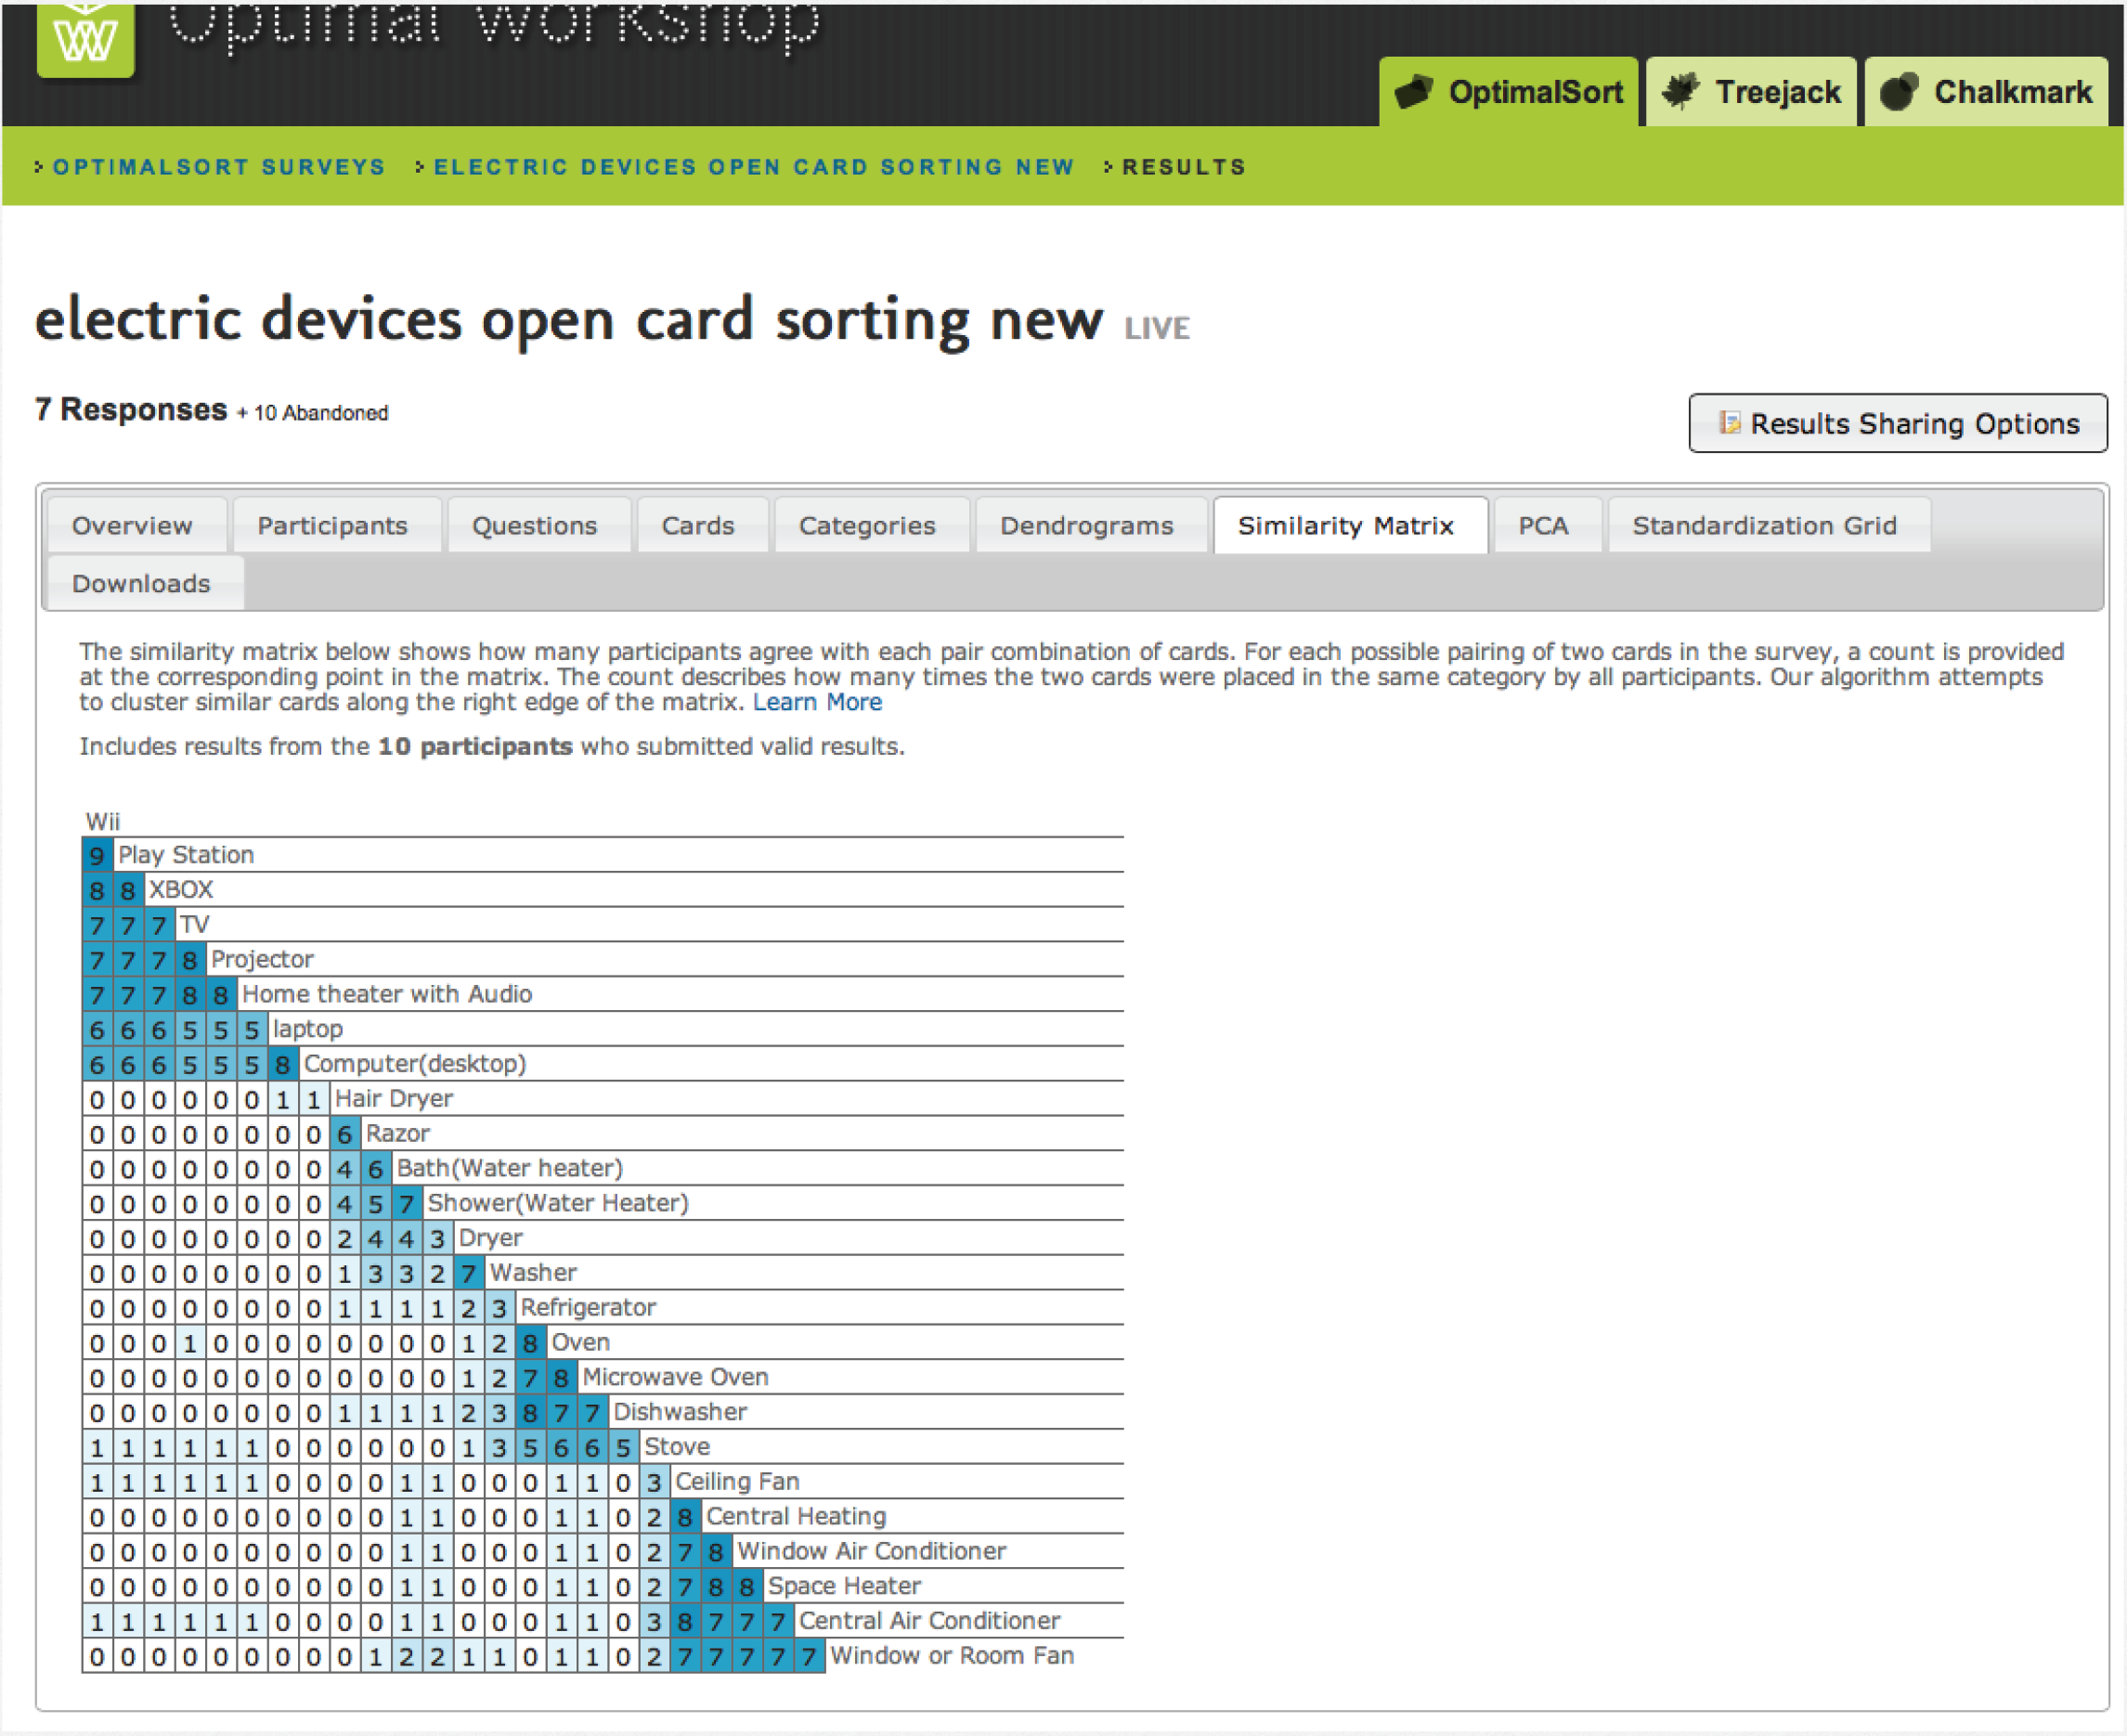
Card Sorting
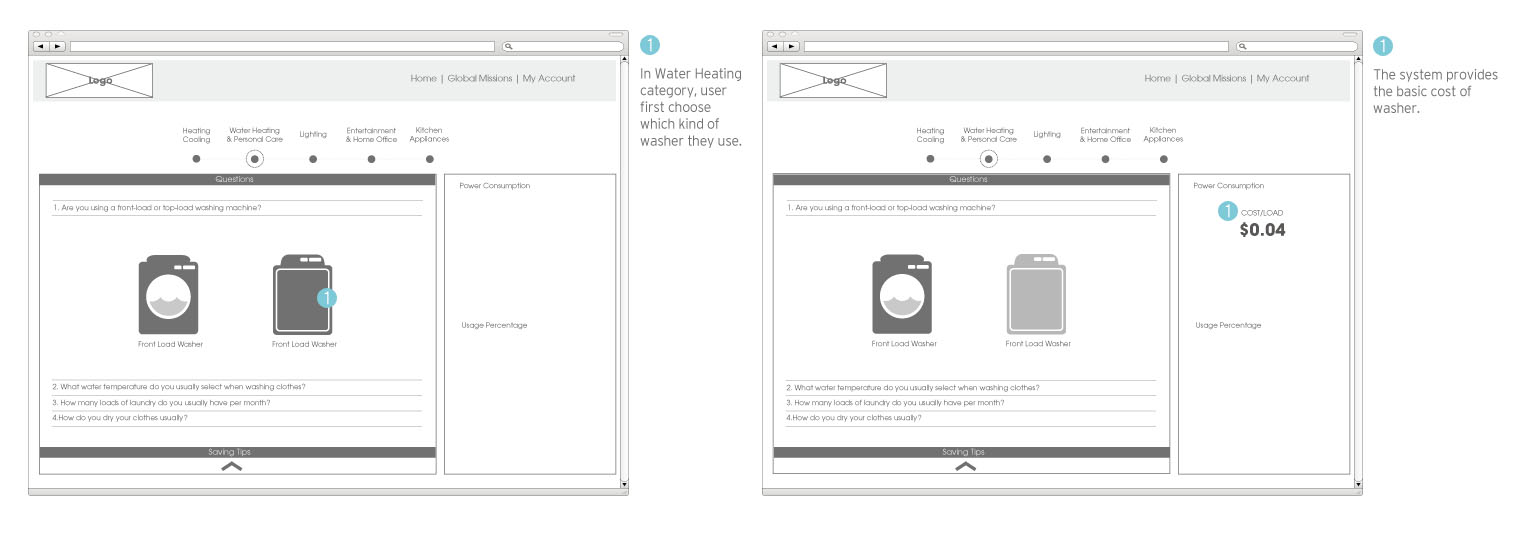
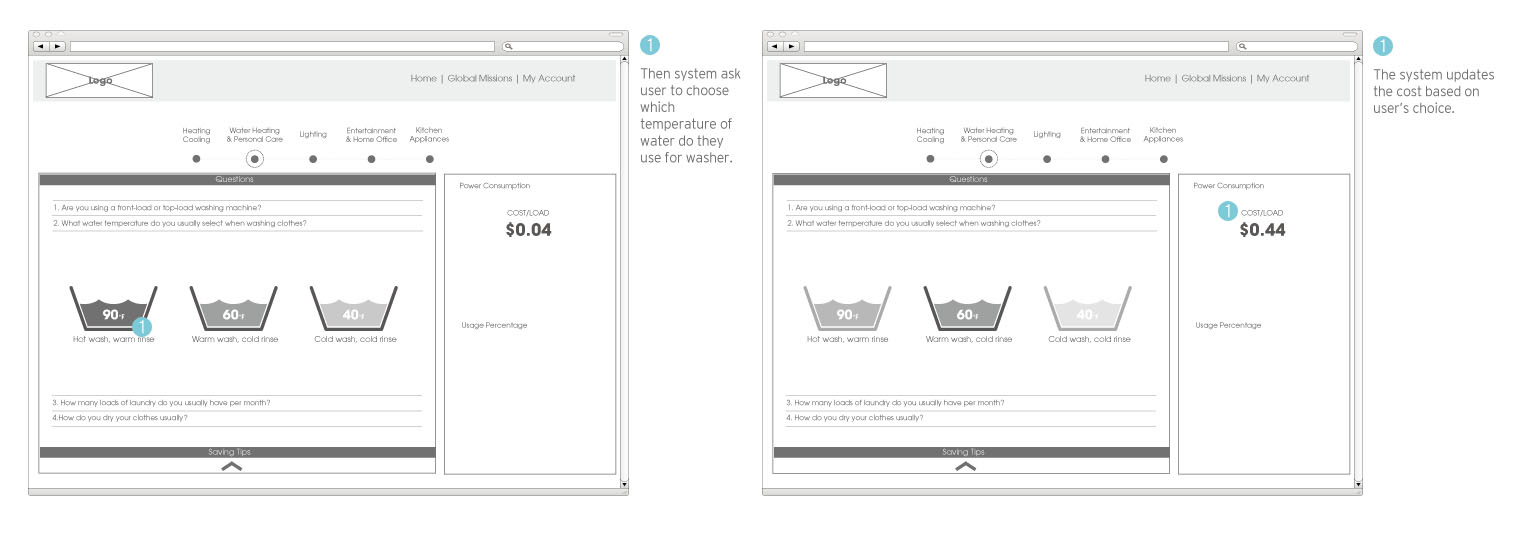
Wireframe
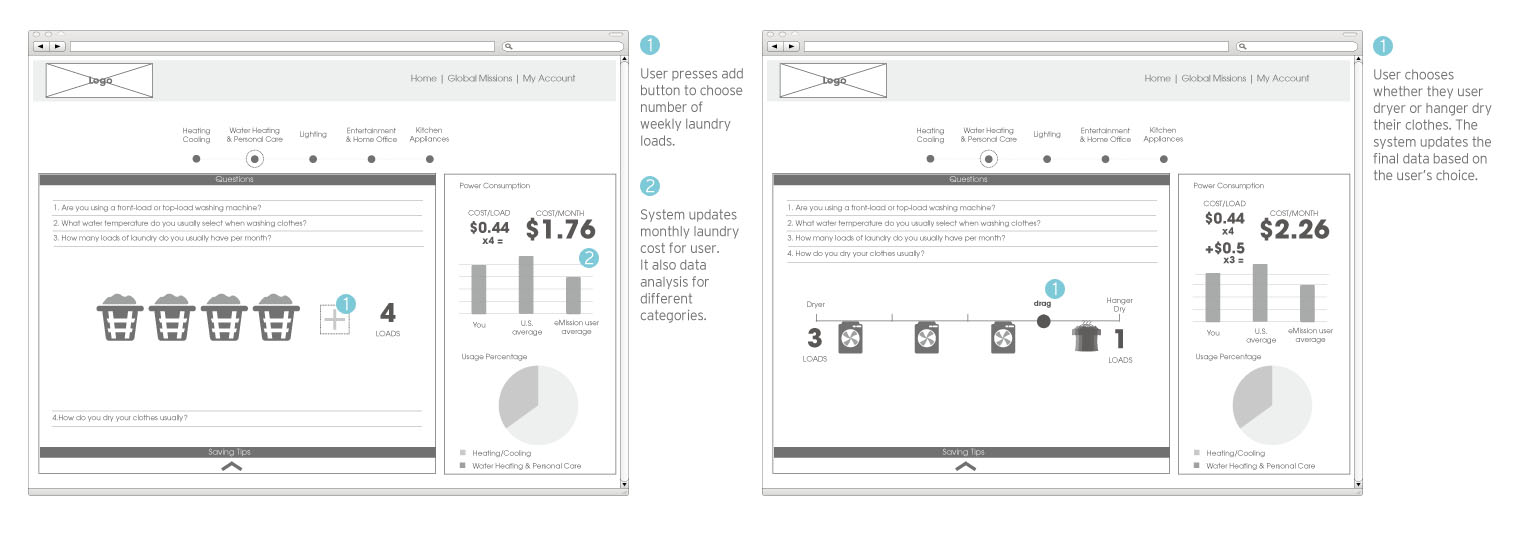
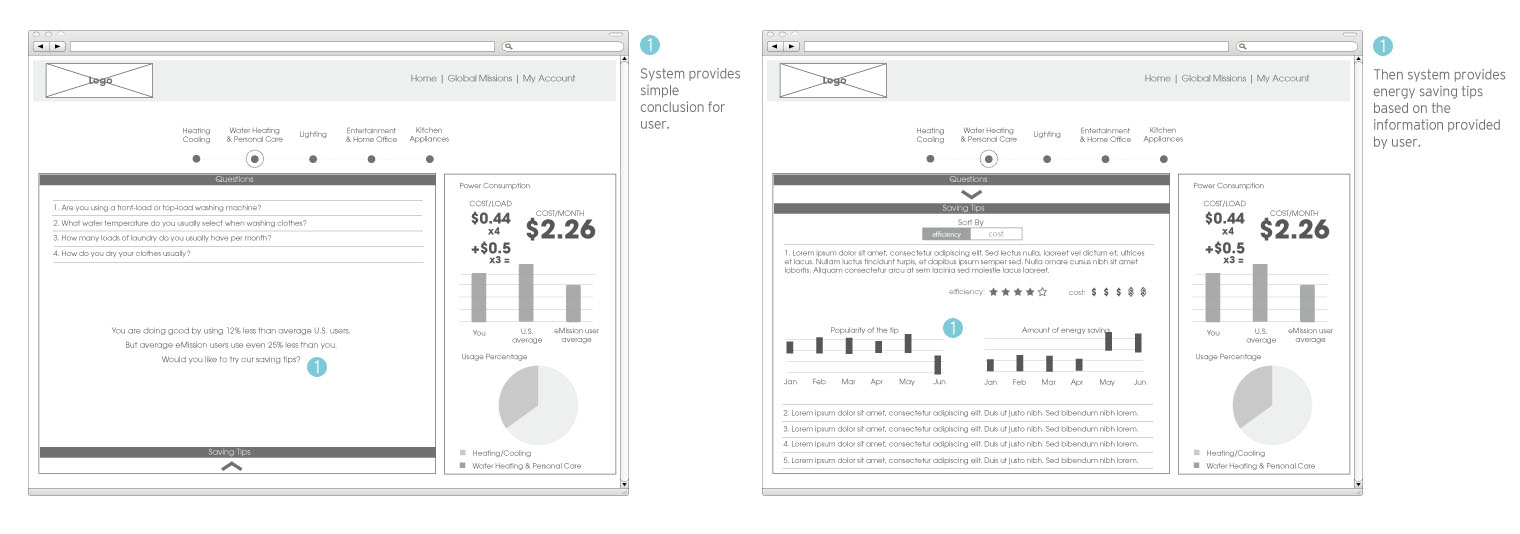
Visual Design
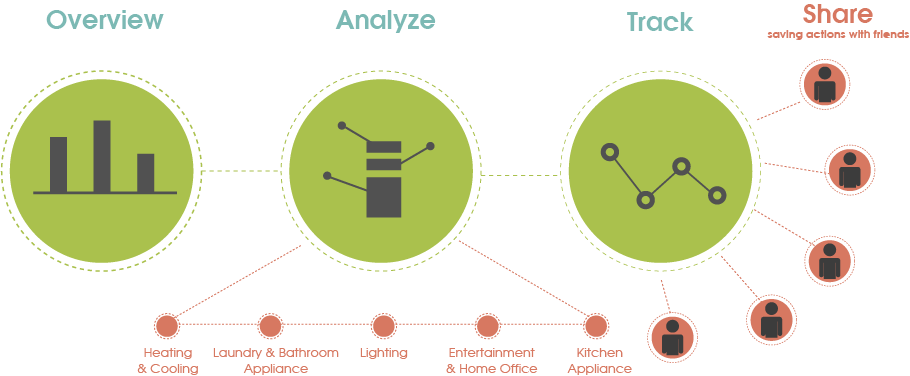
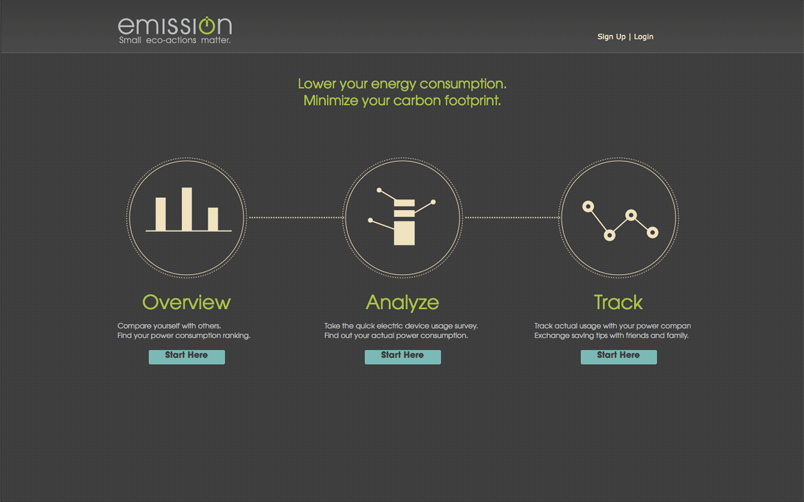
Overview 1/4
User checks the front page and chooses the Overview section.
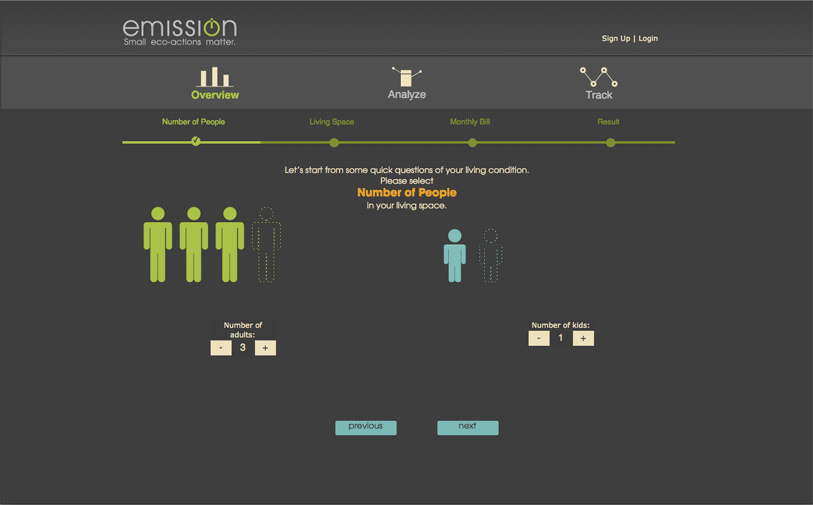
Overview 2/4
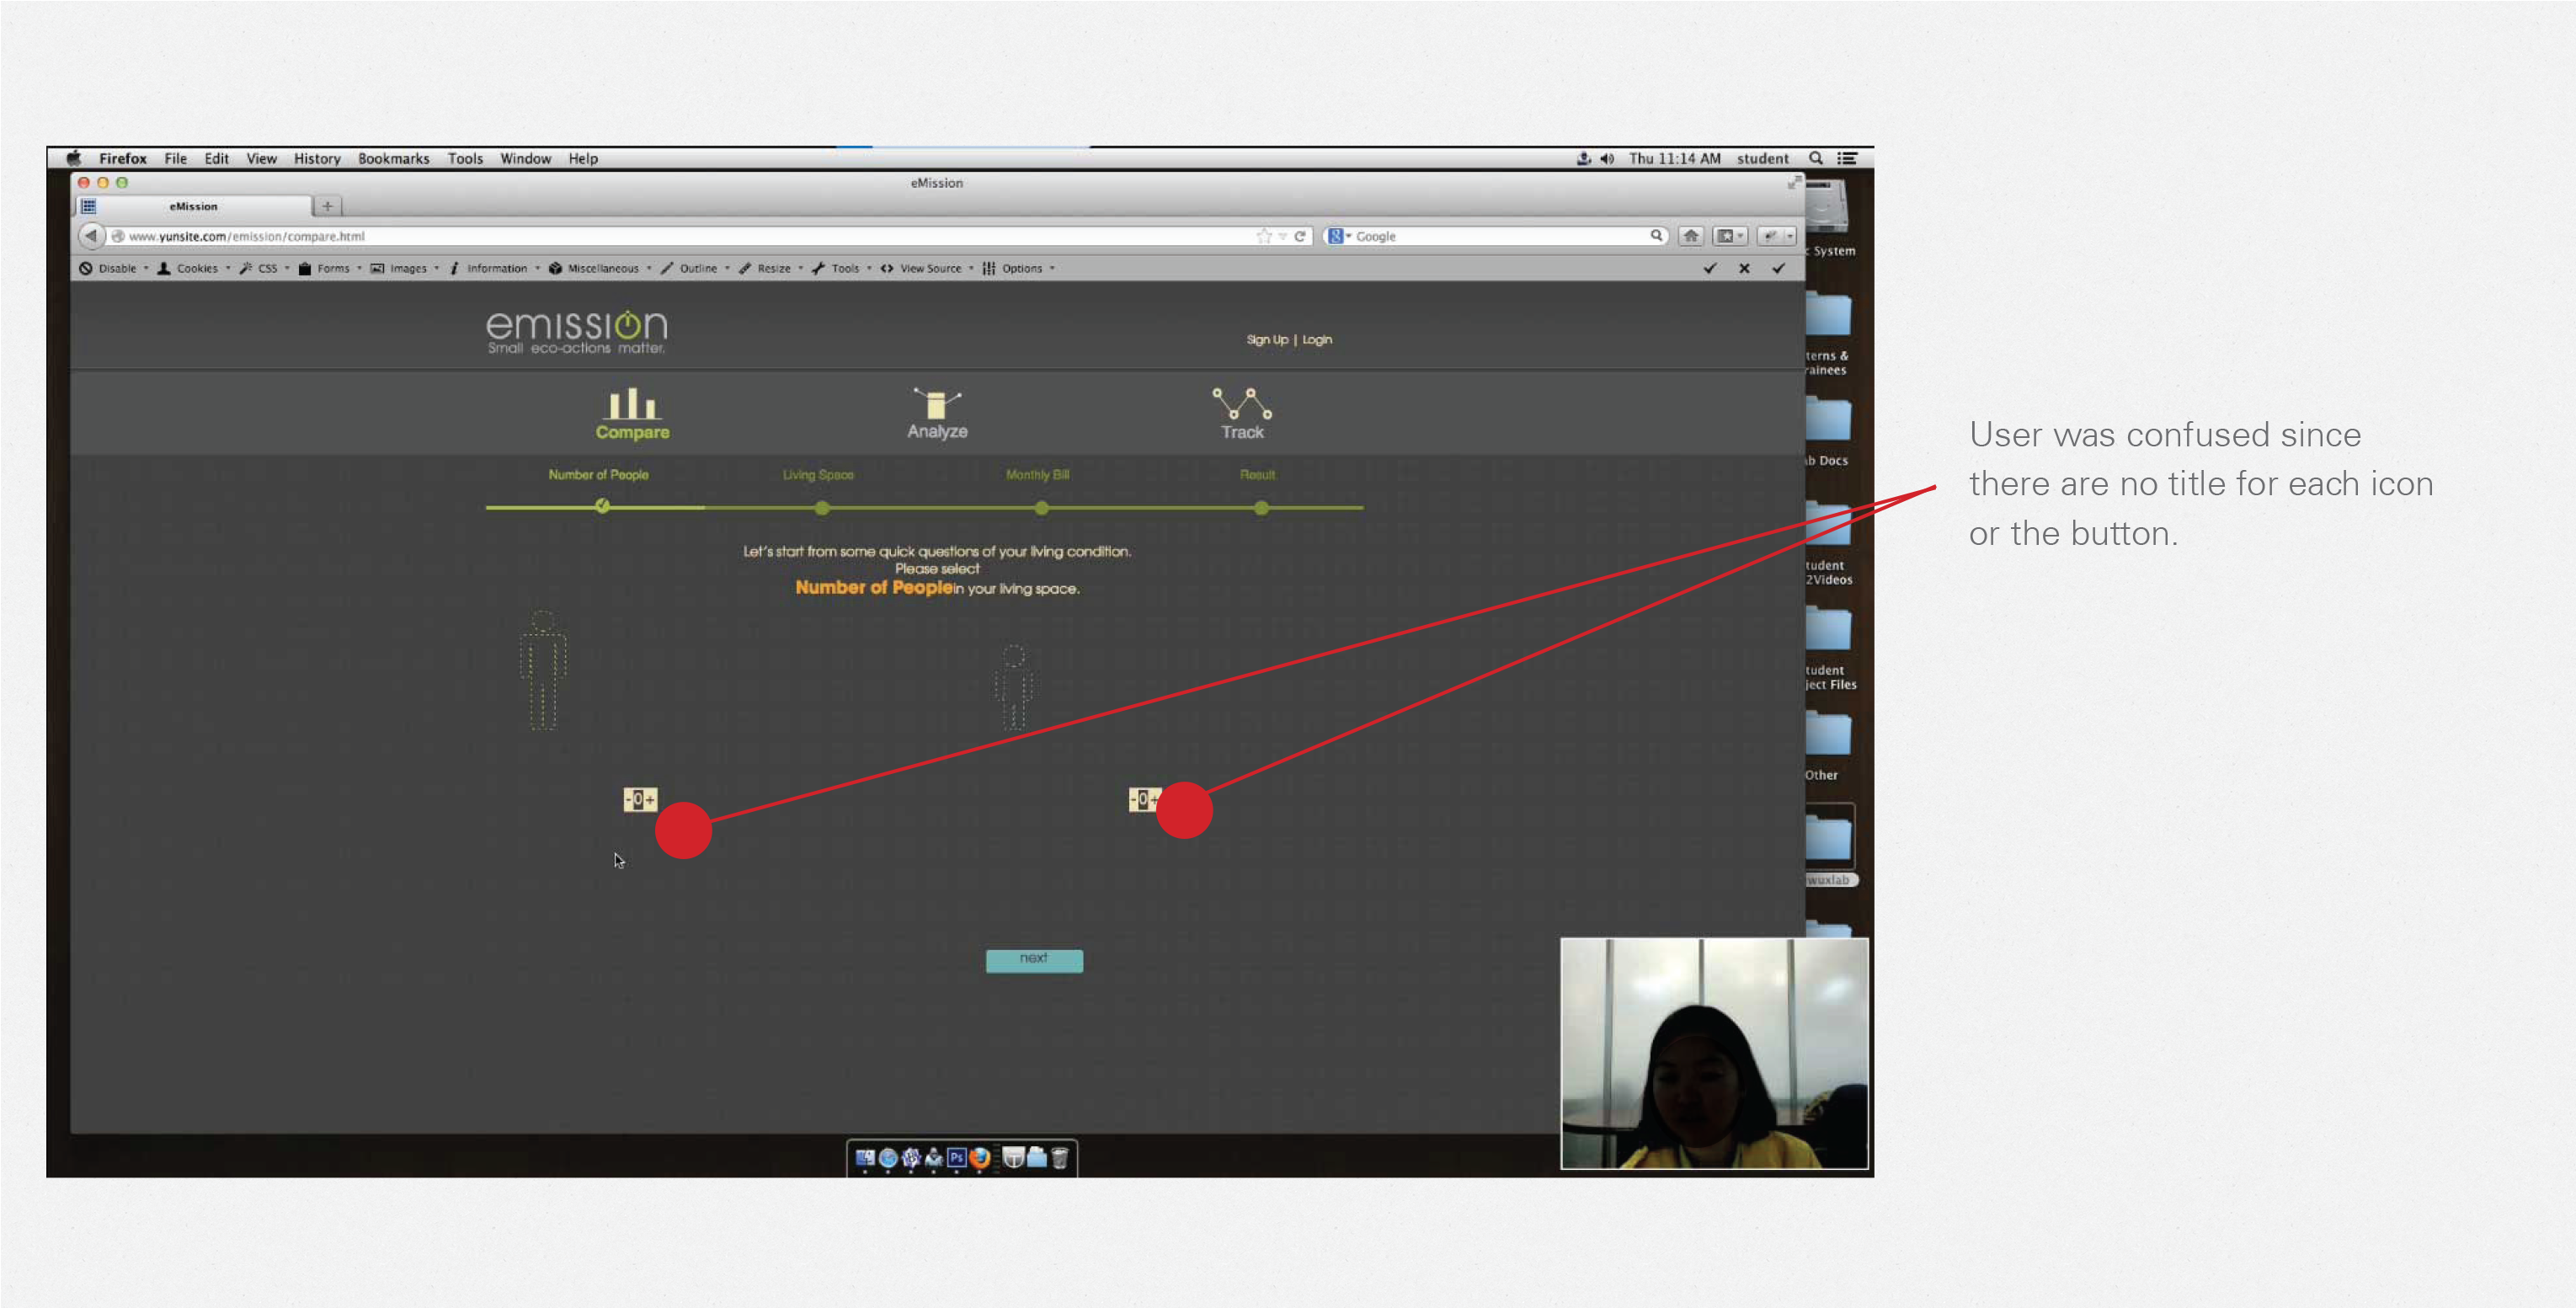
User puts in the number of adults and kids they have at home.
Overview 3/4
User chooses the size of their living space.
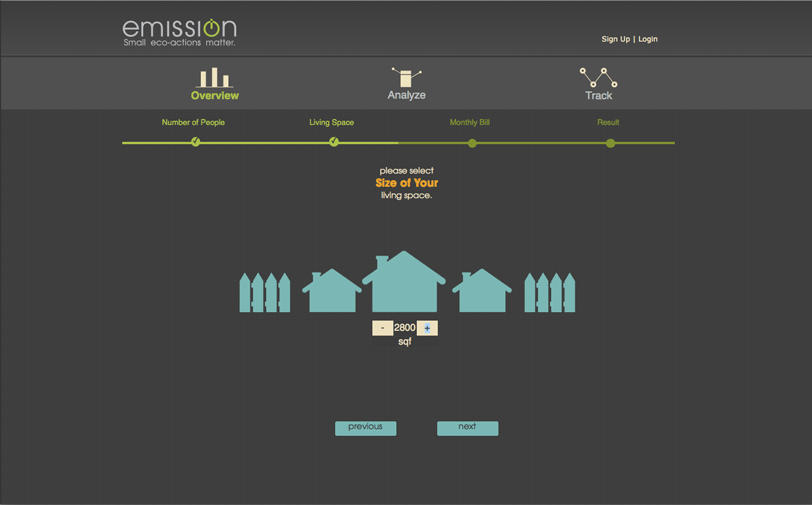
Overview 4/4
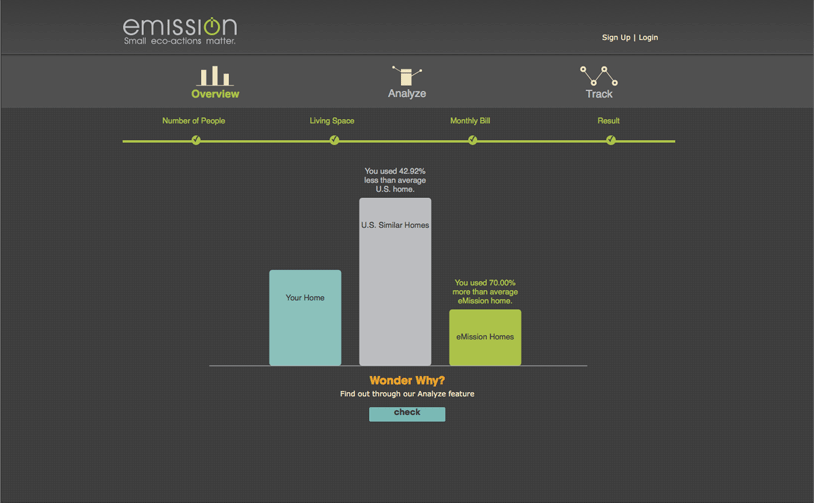
User gets the final result, which compares their usage with U.S. average of similar homes, and other eMission users.
Analyze 1/8
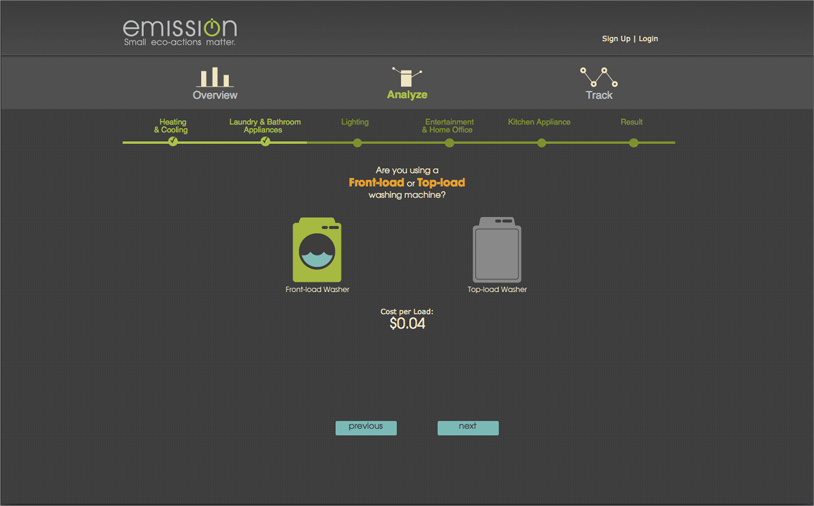
User puts in data for laundry and bathroom appliances section.
Analyze 2/8
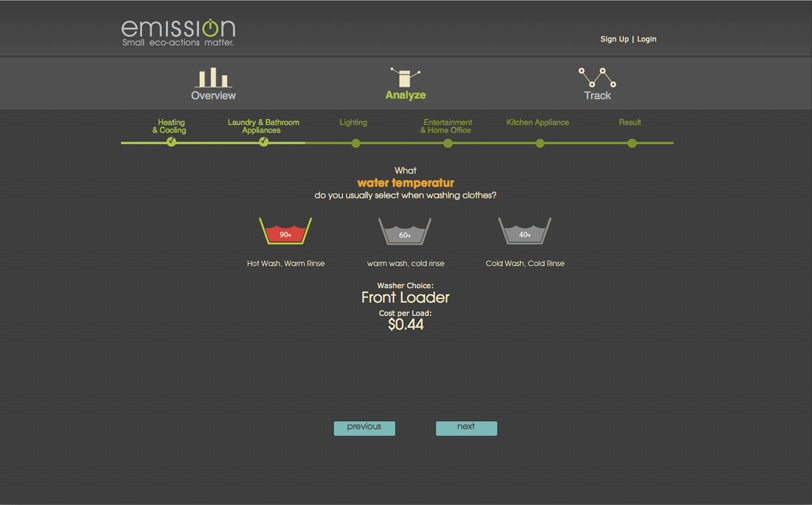
User chooses water temperatur for washing machine.
Analyze 3/8
User chooses numbers of laundry loads they have each month.
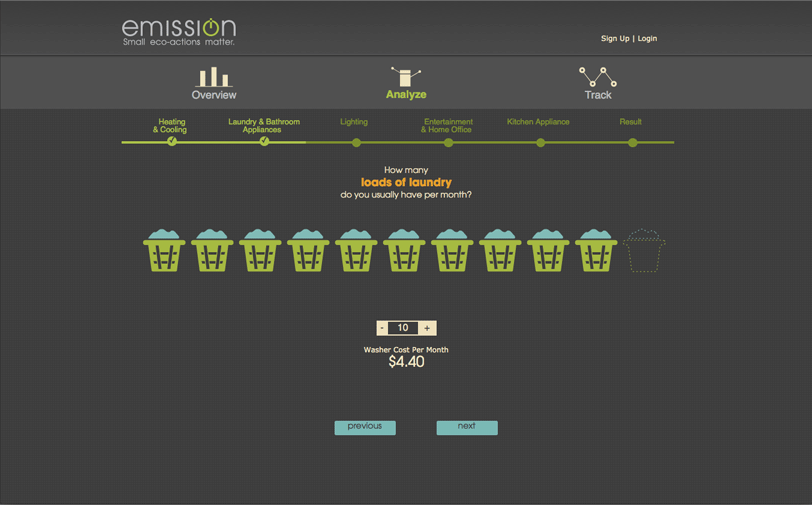
Analyze 4/8
User chooses the way they dry their clothes.
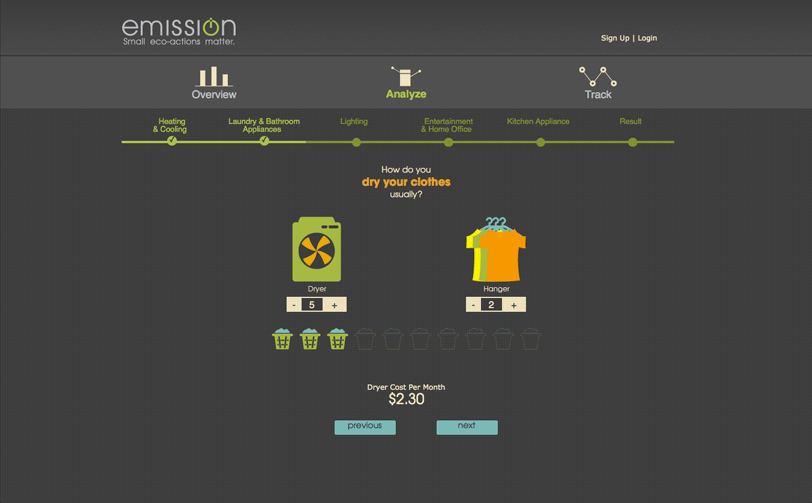
Analyze 5/8
User gets the result of laundry and bathroom appliance category.
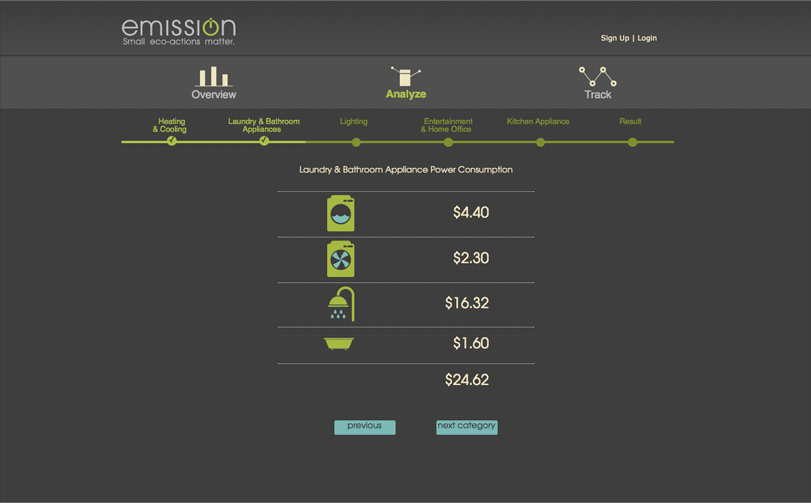
Analyze 6/8
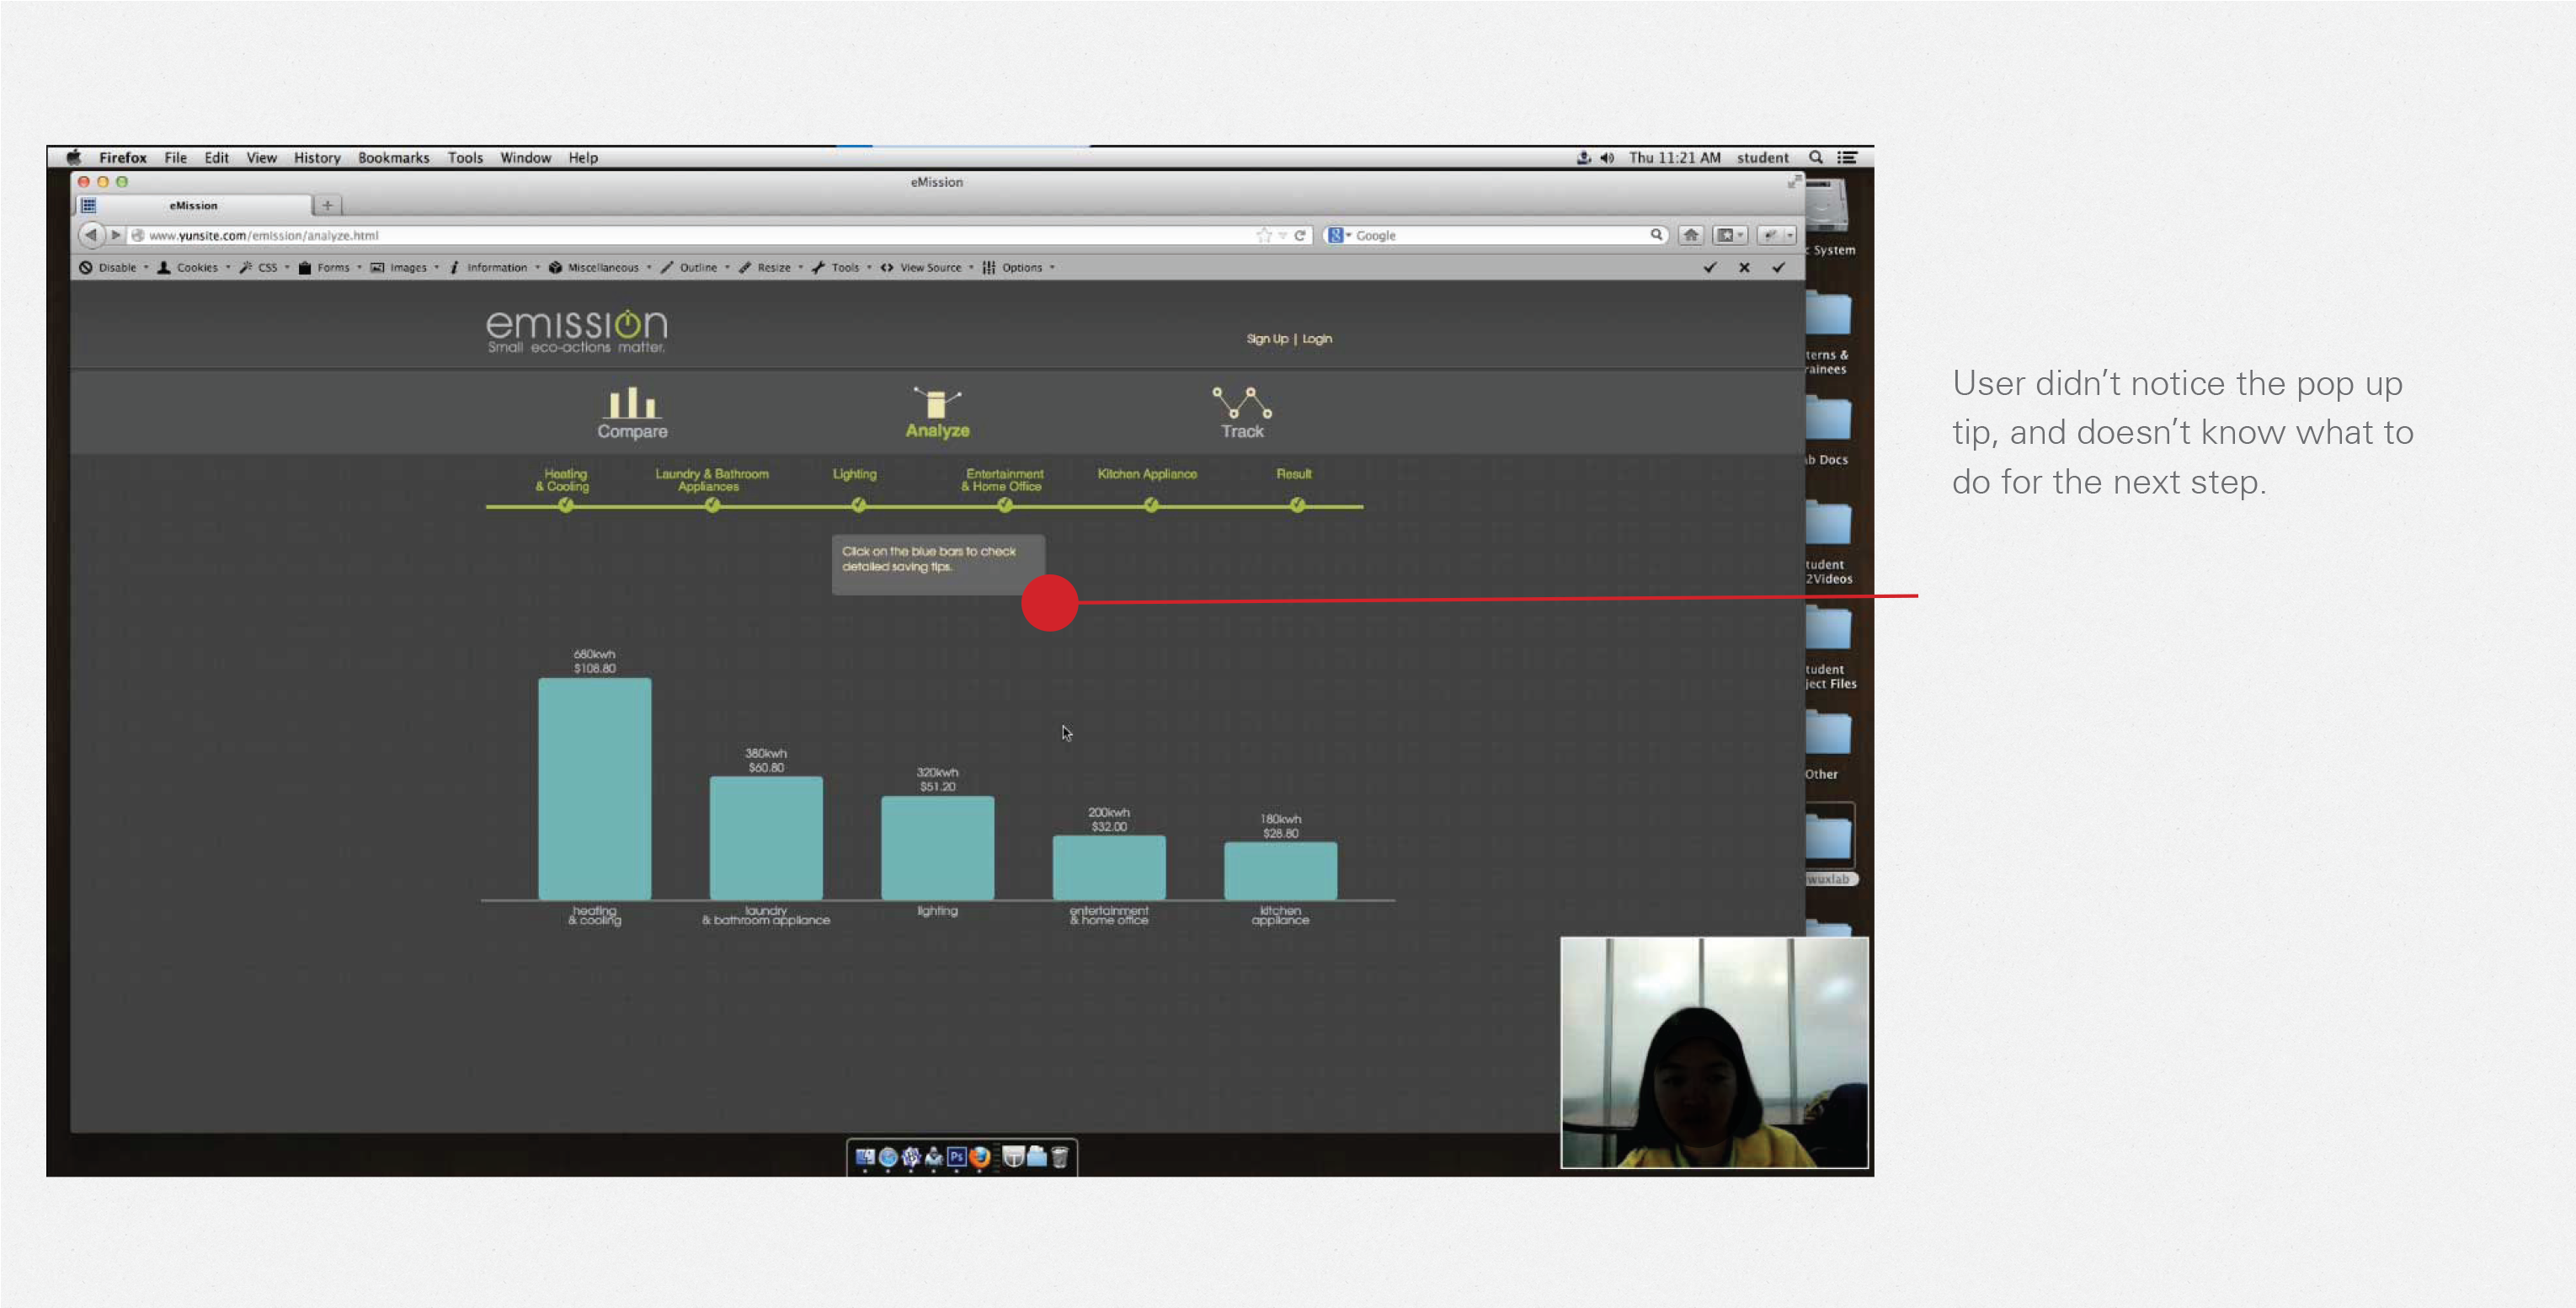
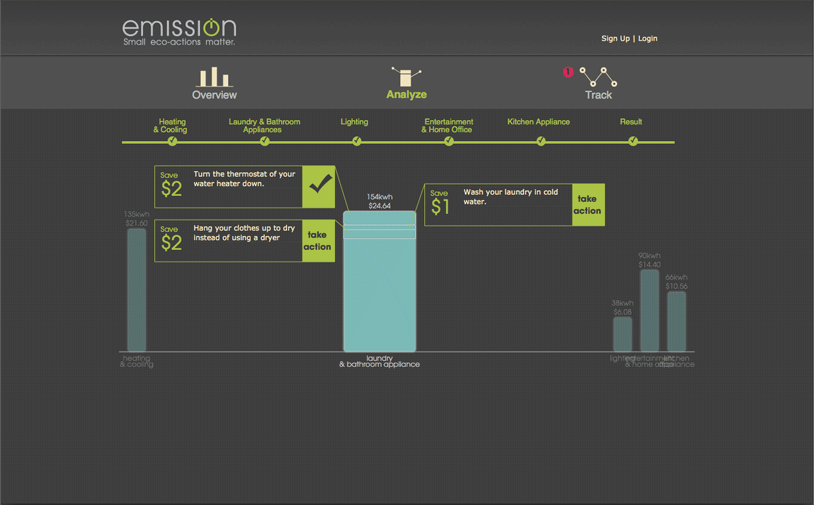
After finishing providing all information, user gets the summary of all five categories.
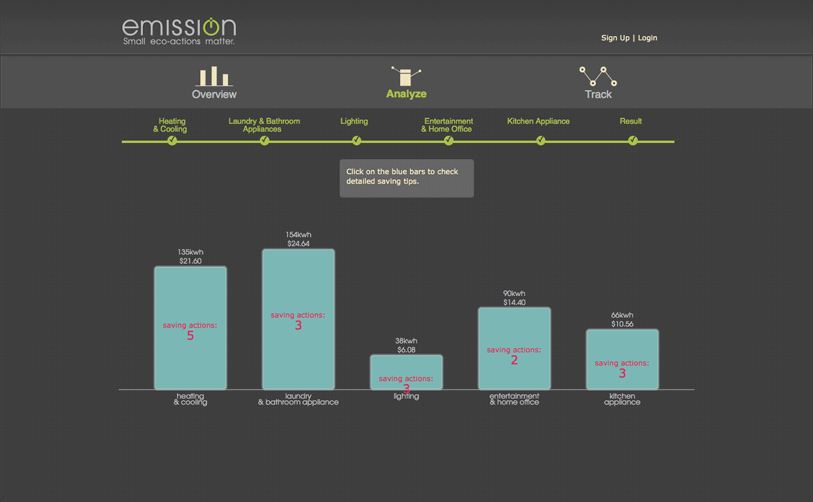
Analyze 7/8
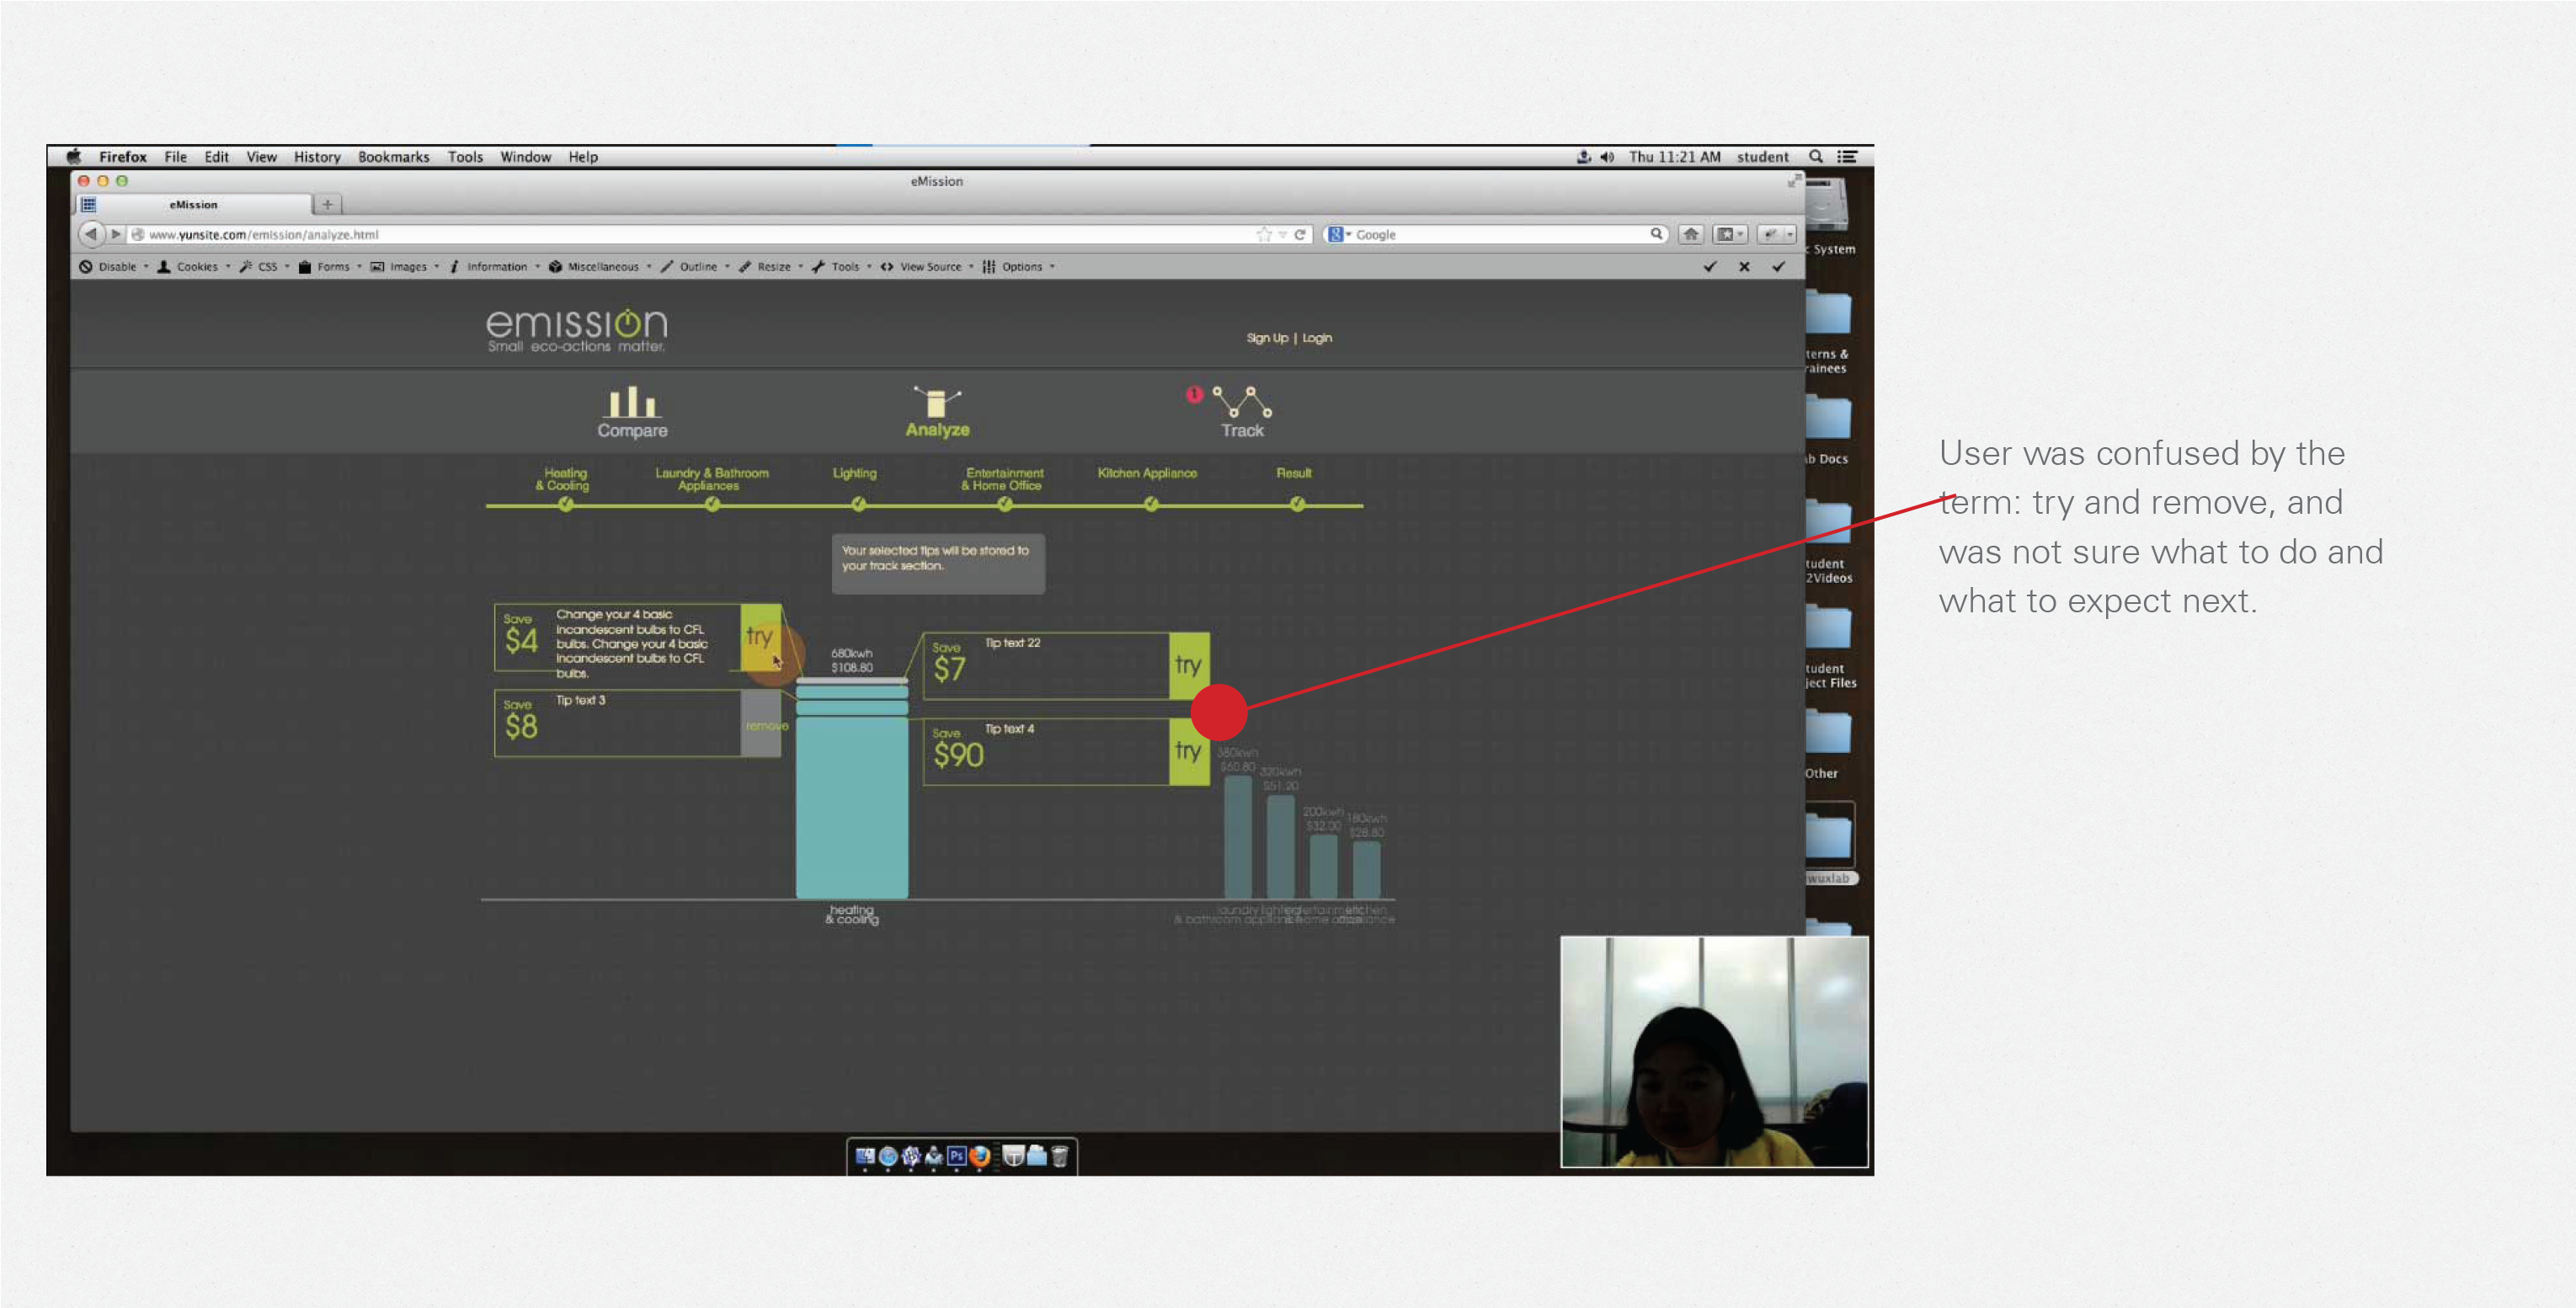
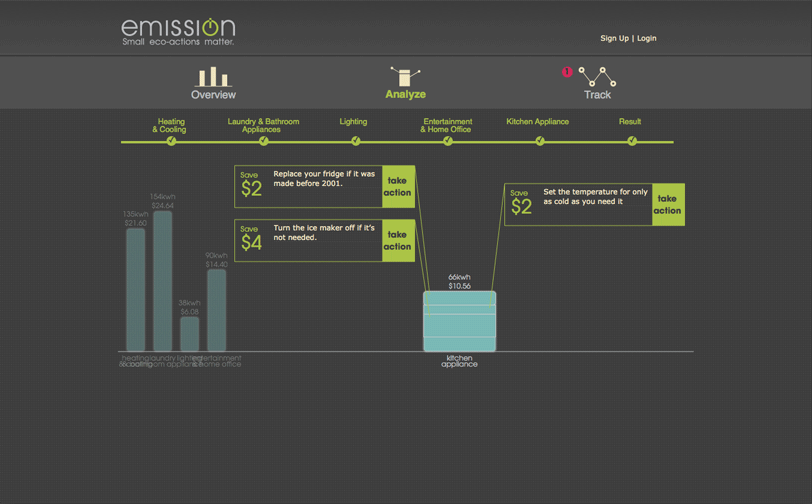
User clicks around to see the saving actions for each category and chooses the actions they want to take.
Analyze 8/8
Selected saving tips will be stored in user's personal account.
Track 1/2
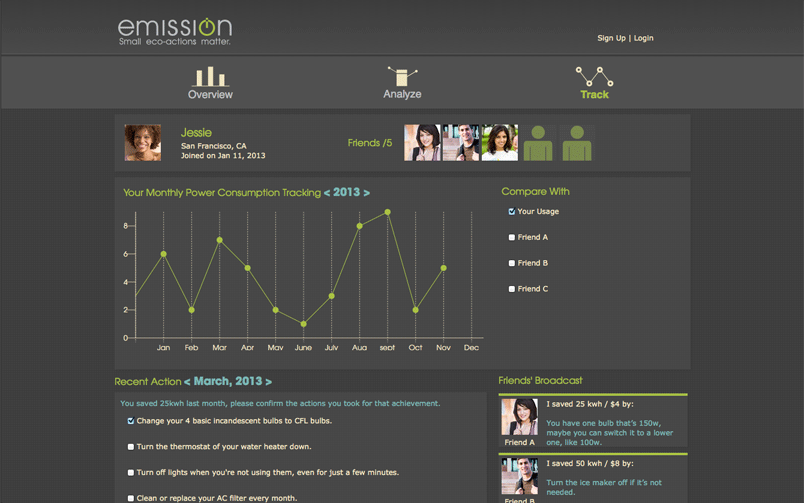
User connects their utility account to eMission, and tracks their monthly usage along with the saving actions they took.
Track 2/2
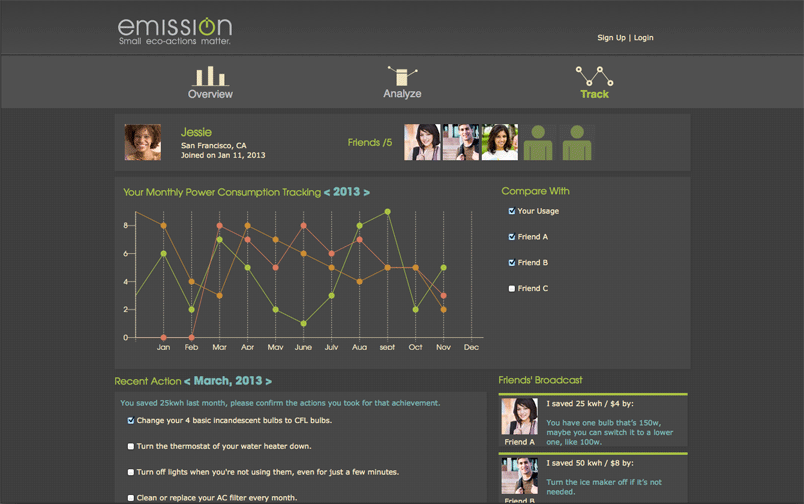
User compairs their consumption with their friends. Also shares useful saving actions with friends.
User Testing
